Searching for the best place to move in 2026? These are the most livable metro areas in the US
Share this article:
Does finding a place where you can live well without breaking the bank seem like a distant dream? We set out to answer that question by analyzing 149 U.S. metro areas using 17 important metrics — like cost of living, healthcare access and community feel — to find the best places to live.
Key takeaways:
RentCafe.com’s annual Most Livable Metro Areas report ranks 149 U.S. metro areas using 17 metrics across three key categories — socioeconomics, quality of life, and location and community.
- The Midwest dominates all regions when it comes to overall livability, with six metro areas ranking in the top 20.
- Washington, D.C. ranks as the most livable U.S. metro, followed by Portland, ME, in second place and Kansas City, MO, in third.
- The Northeast and West are tied for second in overall livability with five metros each. Meanwhile, the South contributes with four metro areas.
- Washington, D.C. takes the lead in both location and community and quality of life, while Springfield, MO, ranks first in socioeconomics.
The clear regional frontrunner this year is the Midwest, which dominates as the region with the most livable metro areas. Among them, Kansas City, MO, and Des Moines, IA, punch well above their weight, ranking third and fourth on our list, respectively fueled by affordability, tech buzz and an active social scene.
However, Washington, D.C., emerges as the most livable metro area thanks to its exceptional quality of life. Specifically, the capital’s focus on wellness, revitalization efforts and unmatched professional networking opportunities helped it climb from seventh place last year to the top spot.
And let’s not forget last year’s #1 — Portland, ME, which now ranks second, driven by a stable job market and countless cultural and culinary offerings.
But, what does livability actually mean? Well, it’s everything that you would care about when choosing where to live, including whether this place can support the well-being and social engagement of its residents.
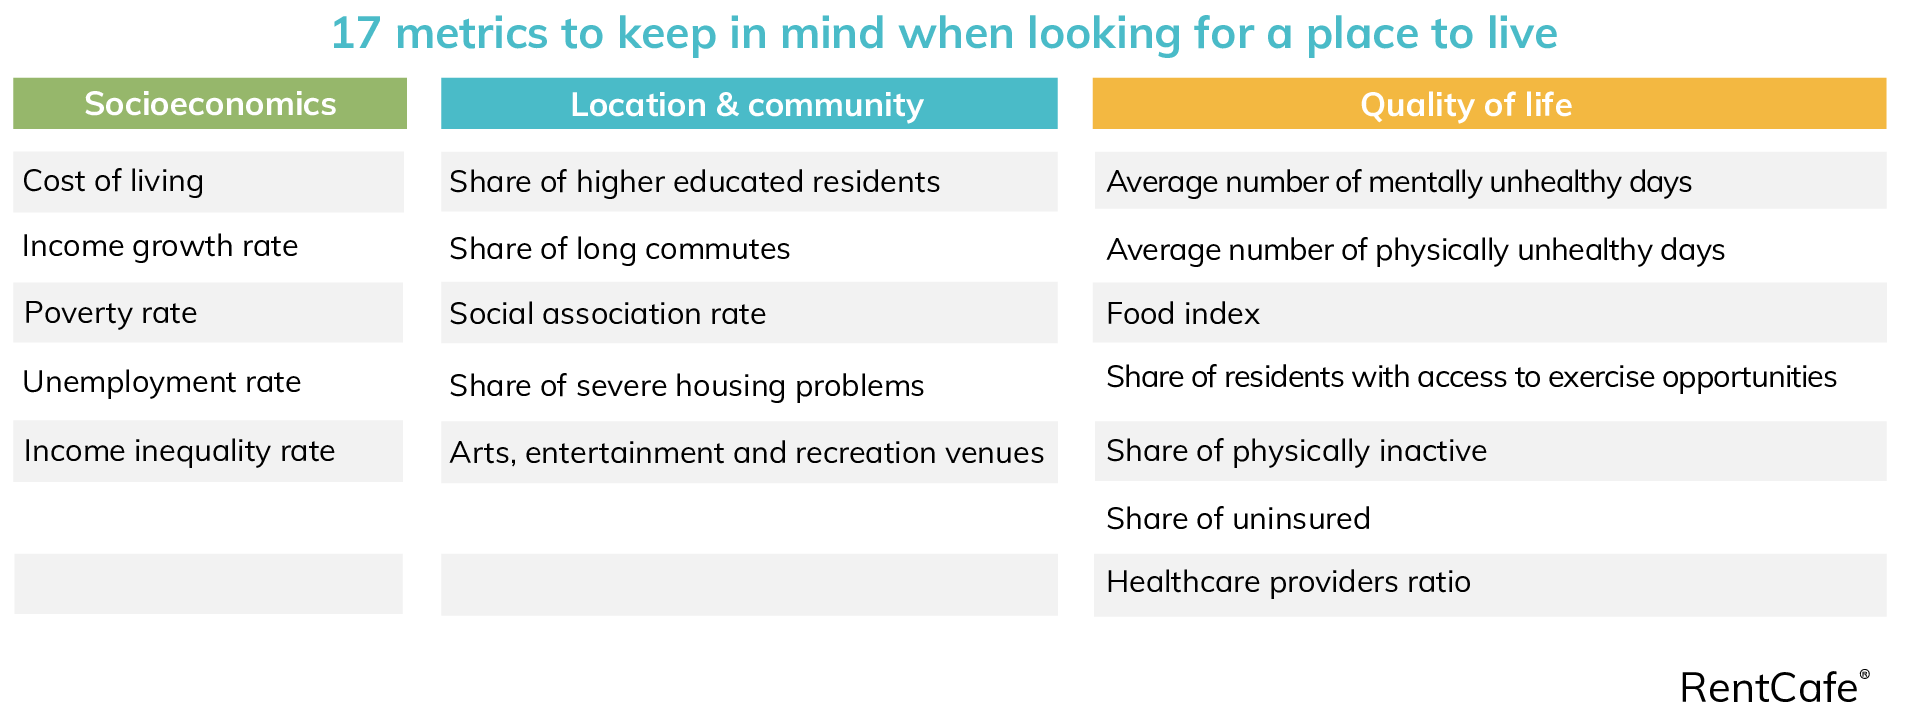
With that in mind, we grouped the most important criteria into three key categories: socioeconomics (aspects like cost of living, income growth rate, unemployment rate, etc.), quality of life (healthcare providers, food index, access to exercise options, etc.), and location and community (share of higher-educated residents; social association rate; arts, entertainment and recreation venues; share of long commutes, etc.).
Explore the rankings below to discover why these cities offer the best living conditions right now, or find out how your current metro area measures up and where improvements could be made:
1. Washington, D.C.
Ranked #1 for quality of life; location and community; and overall livability, Washington, D.C.’s focus on wellness and ongoing revitalization efforts helped it climb from seventh place last year to the top spot.
However, what truly sets the capital apart are its powerful networking opportunities: Leading the nation with a social association rate twice that of runner-up Huntington, WV, renters here have access to more than 2,000 professional membership associations to connect with peers.
And, let’s not forget the historic landmarks, variety of healthcare providers, and access to green spaces and athletic fields, which make D.C. a top spot for renters looking for work/life balance.

What are the Washington, D.C., metro area’s top-performing metrics?
- Diverse healthcare providers
- High share of higher-educated residents
- High number of social clubs and community organizations
- Plenty of arts and entertainment venues
Who is this metro area perfect for? Young professionals, health-conscious residents, and culture-seekers who crave a city that can offer them all.
2. Portland, ME
Portland ranks #2 this year after taking the top spot last year. This metro area offers access to a large number of membership associations, local farmers’ markets, top universities and a robust network of healthcare providers (37 per 10,000 individuals — the third-highest ratio among the 149 metro areas we analyzed).
Although the cost of living here exceeds the national average, Portland’s steady job market, income gains and low unemployment rate make it appealing to renters looking for stability.
But, it’s not just a spot where you can work hard: The metro area also stands out for its rich food scene, with 230 restaurants per 10,000 residents, an impressive Arts District, and plenty of organized sports programs.
As such, it’s no surprise that the metro ranks high for location and community (#2) as well as quality of life (#5).

What are the Portland metro area’s top-performing metrics?
- Access to fresh, local food sources
- Great higher education opportunities
- Extensive healthcare provider network
- Plenty of sports facilities
Who is this metro area perfect for? Active individuals and food-lovers seeking the perfect spot where they can mix business with leisure.
3. Kansas City, MO
Kansas City, MO, ranks third on our list of most livable metro areas. This is due to a steady income growth rate, in addition to a cost of living that’s 12% below the national average, which pushed the metro to the fourth spot in socioeconomics and fifth for location and community.
On top of that, almost all KCMO residents (98%) can easily find a place to exercise. Whether that means a late-night workout in one of the city’s 24-hour gyms or jogging in any of the area’s 200+ parks, there’s plenty of options to pick from.
Moreover, only one in five people living here face a long commute — one of the lowest ratios among the metros in our report (9th nationwide).
At the same time, nearly 85% of KCMO residents are highly educated thanks to the more than 20 colleges, universities and technical schools in the region, including the University of Missouri – Kansas City.

What are the Kansas City metro area’s top-performing metrics?
- Local fresh food options
- Top-tier educational institutions
- Wide range of sports venues
- Shorter commutes
Who is this metro area perfect for? Go-getters who crave fresh flavors, smart opportunities, thrilling sports, and more time to enjoy it all.
4. Des Moines, IA
Des Moines takes the #4 spot nationwide, while also ranking #3 for location and community, and #12 for socioeconomics. This metro area appeals to renters due to its short daily commutes, as only one in five residents spends more than 30 minutes in traffic.
At the same time, Des Moines has the fifth-smallest share of residents who face housing problems among all metros in our report.
What’s more, due to the presence of several high-profile educational institutions, the area’s population skews toward the higher educated as many graduates become integrated into the metro’s insurance, financial, and growing tech sectors.

What are the Des Moines metro area’s top-performing metrics?
- Farm-fresh food availability
- Excellent college and university options
- Diverse medical and health services
- Brief daily commutes
Who is this metro area perfect for? Health-conscious residents and budget-minded individuals who want a commute that doesn’t steal their day.
5. Ann Arbor, MI
Coming in fifth is Ann Arbor, MI. This metro area stands out with a #4 ranking for quality of life and #13 for location and community, by promising renters access to healthy food options, as well as plenty of outdoor venues such as parks and nature areas.
Furthermore, Ann Arbor has the second-largest number of healthcare providers (38 per 10,000 population) among the 149 spots on our list.
Notably, young professionals would also find the metro area appealing due to it having the fourth-highest income growth (7%) nationwide and large number of membership associations.
Plus, thanks to the presence of educational institutions like the University of Michigan and career schools, renters looking for a metro area where they can expand their professional circle will be able to find like-minded individuals.
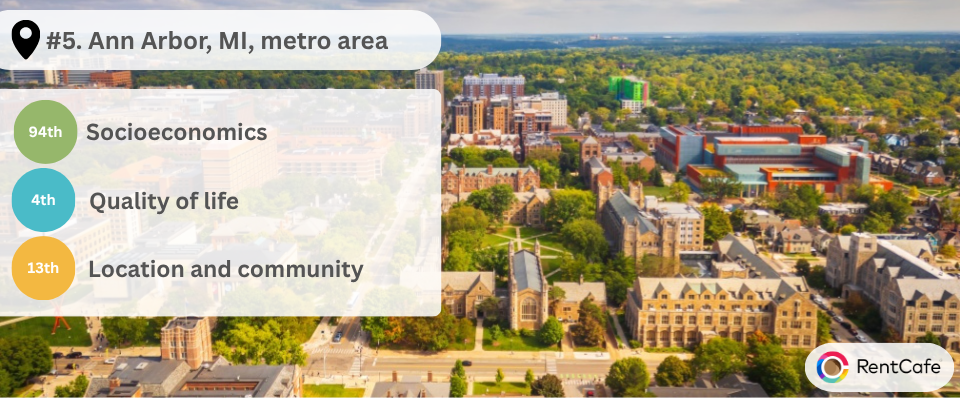
What are the Ann Arbor metro area’s top-performing metrics?
- Great higher education opportunities
- Diverse healthcare providers
- Access to fresh, local food sources
- Plenty of sports facilities
- More than 100 membership associations
Who is this metro area perfect for? Culture-seekers and renters who value wellness and are seeking a lifestyle that keeps them active and entertained.
6. Albany, NY
The Albany, NY, metro area ranks #6 in overall livability this year. With its access to athletic fields, around 660 membership associations and plenty of entertainment venues, it’s no wonder that this Northeastern hotspot scores #4 for location and community and #19 for quality of life.
It’s also helped, in large part, by the fact that only one in five people spends more than 30 minutes in traffic here. The New York capital also offers steady job opportunities, as evidenced by its low unemployment rate (3.5%).

What are the Albany metro area’s top-performing metrics?
- Access to fresh, local food sources
- Great higher education opportunities
- Plenty of sports facilities
- Shorter commutes
Who is this metro area perfect for? Socially engaged residents, active professionals, and lifelong learners seeking a connected, well-rounded lifestyle.
7. Columbus, OH
With a cost of living that’s 4.7% below the national average, Columbus, OH, ranks seventh for livability. This Midwestern hub’s appeal lies in its focus on wellness, as demonstrated by its farm-to-table initiatives — which make it easier for residents to access healthy, organic food — along with a variety of sports facilities, including pools, fitness centers and trails.
As a result, the metro ends up ranking #11 for location and community and #14 for quality of life.
If that isn’t appealing enough, renters might also be interested in the metro area’s economic focus on fields such as education, technology, and finance, thanks to the presence of companies such as DHL, Worthington Enterprises, and Elford.
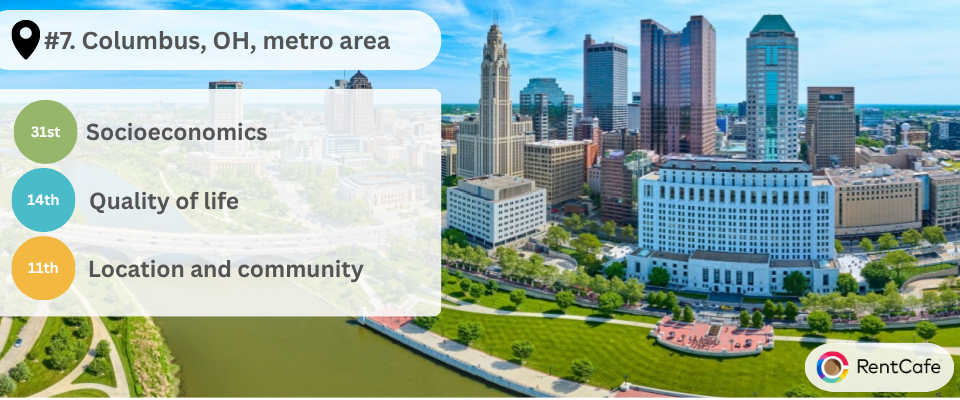
What are the Columbus metro area’s top-performing metrics?
- Plenty of healthy food sources
- Strong access to higher education
- Numerous sports complexes
Who is this metro area perfect for? Foodies who are looking for new culinary hotspots, in addition to employment opportunities.
8. Asheville, NC
The Asheville, NC, metro area holds the #8 spot in overall livability. Known for its mountain-town vibes, this area’s appeal lies in its income growth rate (8%, third-highest nationwide) and its focus on overall wellness, offering access to more than 3,000 healthcare providers.
It’s worth noting here that, only one in five residents spends more than half an hour commuting every day, which allows them more time to build a vast social network, thanks to the more than 400 membership associations present in the area.
With Asheville keeping its residents physically well as well as socially engaged, it’s no wonder that the metro area ranks #6 for location and community.
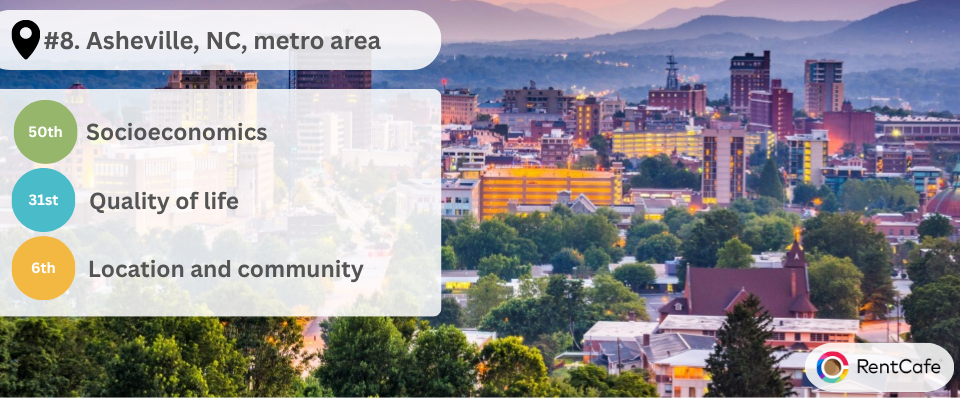
What are the Asheville metro area’s top-performing metrics?
- Diverse healthcare providers
- More than 400 membership associations
- Less time spent commuting
- Steady income growth
Who is this metro area perfect for? Social butterflies, wellness-seekers, and nature-lovers looking to form life-long friendships.
9. Harrisburg, PA
The ninth place for overall livability belongs to the Harrisburg, PA, metro area, which promises renters not only affordability (#13 in socioeconomics), but also plenty of opportunities to become social butterflies (#9 for location and community).
Accordingly, renters here can look forward to a metro area that hosts approximately 250 membership associations, an infrastructure that’s designed to shorten the time spent commuting, and a steady income growth thanks to the presence of employers like Hershey, Sheetz Inc., and various healthcare providers.
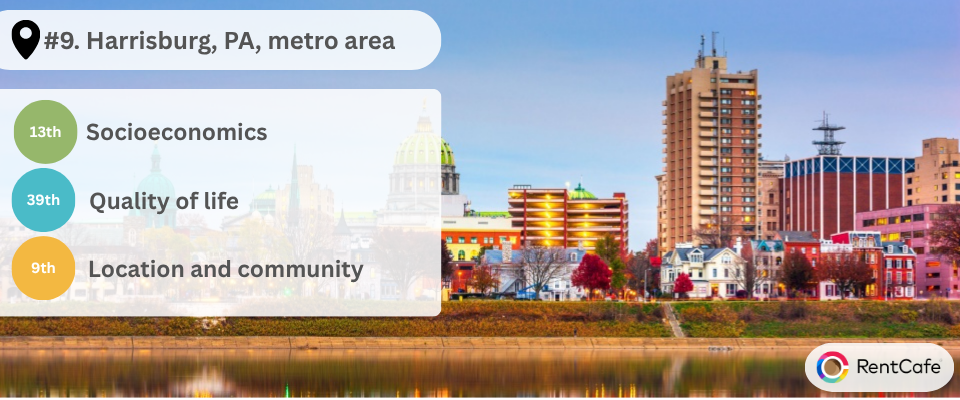
What are the Harrisburg metro area’s top-performing metrics?
- Healthy food options
- More than 250 membership associations
- Less time spent commuting
Who is this metro area perfect for? Budget-conscious professionals who are looking for fresh meals and scenic views.
10. Boise, ID
Boise, ID, rounds out the top 10 in overall livability, while also ranking #30 in socioeconomics and #19 in location and community.
This rapidly growing metro area stands out as a hub for economic opportunities thanks to its labor force growth in key sectors like construction, manufacturing and education, along with a low unemployment rate.
Moreover, the city offers renters access to healthy food thanks to its vertical farms, as well as more than 100 parks and annual events like the Hyde Park Street Fair, making it perfect for those who both work hard and play hard.

What are the Boise metro area’s top-performing metrics?
- Easy access to healthy, organic food
- Plenty of exercise opportunities
- Shorter commutes
Who is this metro area perfect for? Active individuals and nature lovers who appreciate a city that offers a laidback, outdoor-friendly lifestyle.
Midwest edges out West and Northeast in livability
When it comes to livability, the Midwest takes the lead with six metro areas making our top 20 list: Kansas City, MO (#3); Des Moines, IA (#4); Ann Arbor, MI (#5); Columbus, OH (#7); Indianapolis (#11); and Minneapolis (#16).
Overall, Midwestern metros consistently rank high across key categories. For instance, Kansas City and Des Moines shine in location and community, ranking fifth and third respectively, while Ann Arbor stands out for quality of life at number four. Meanwhile, Minneapolis leads in socioeconomics, coming in eighth thanks to its affordability and steady income growth.
On the West Coast, Boise, ID, takes the 10th spot in our national ranking. This region counts five metro areas in the top 20, including Fort Collins, CO (#12); Seattle (#13); Spokane, WA (#19); and Colorado Springs, CO (#20).
Not to outdone, the Northeast also claims five positions, led by Portland, ME, which ranks second nationally. Other notable cities include Albany, NY (#6); and Harrisburg, PA (#9); thanks to their welcoming and lively community, as well as Pittsburgh (#14); and Manchester, NH (#15).
Finally, the South is represented by four metro areas — Washington, D.C., which tops both regional and national rankings; Asheville, NC (#8); Wilmington, NC (#17); and Baltimore (#18).
Top 5 metro areas by socioeconomics
Top 5 most livable metros by socioeconomics
| Metro | Total population | Socioeconomics rank | Quality of life rank | Location & community rank | Final rank |
|---|---|---|---|---|---|
| Springfield, MO | 487,252 | 1 | 105 | 29 | 54 |
| Charleston, SC | 853,229 | 2 | 82 | 80 | 64 |
| Spokane, WA | 590,317 | 3 | 41 | 45 | 19 |
| Kansas City, MO | 2,224,701 | 4 | 6 | 5 | 3 |
| Ogden, UT | 662,649 | 5 | 52 | 118 | 58 |
Table: RentCafe • Source: RentCafe analysis of data from Yardi Matrix, Cost of Living Index, U.S. Census Bureau, Census Business Dynamics, County Health Rankings, as of September 2025 • Get the data
Other spots to watch include Spokane, WA (#3); Kansas City, MO (#4); and Ogden, UT (#5). All three shine for affordable living and steady income growth, with Spokane standing out the most thanks to its remarkable income growth of 11% up over the years.
Top 5 metro areas by quality of life
If your main priority is living your best life, these five metro areas are perfect for social butterflies chasing healthy living. Leading the way is the Washington, D.C., metro, which is full of diverse workout options and plenty of healthy food choices, along with a significant focus on mental wellness.
Top 5 most livable metros by quality of life
| Metro | Total population | Quality of life rank | Socioeconomics rank | Location & community rank | Final rank |
|---|---|---|---|---|---|
| Washington, D.C. | 6,333,457 | 1 | 133 | 1 | 1 |
| Seattle, WA | 4,072,496 | 2 | 123 | 40 | 13 |
| San Francisco, CA | 4,550,043 | 3 | 132 | 98 | 33 |
| Ann Arbor, MI | 355,524 | 4 | 94 | 13 | 5 |
| Portland, ME | 557,889 | 5 | 20 | 2 | 2 |
Table: RentCafe • Source: RentCafe analysis of data from Yardi Matrix, Cost of Living Index, U.S. Census Bureau, Census Business Dynamics, County Health Rankings, as of September 2025 • Get the data
Next up is Seattle, followed closely by San Francisco (#3), Ann Arbor, MI, and Portland, ME — all famous for their amazing fitness scenes and healthy food spots.
Top 5 metro areas by location and community
Finally, it’s the people who really make a place special, so finding your community matters. Here again, Washington, D.C. leads the pack and also ranks as the most livable metro area in the country.
Top 5 most livable metros by location & community
Metro |
Total population |
Location & community rank |
Socioeconomics rank |
Quality of life rank |
Final rank |
|---|---|---|---|---|---|
| Washington, D.C. | 6,333,457 | 1 | 133 | 1 | 1 |
| Portland, ME | 557,889 | 2 | 20 | 5 | 2 |
| Des Moines, IA | 740,702 | 3 | 12 | 29 | 4 |
| Albany, NY | 874,061 | 4 | 78 | 19 | 6 |
| Kansas City, MO | 2,224,701 | 5 | 4 | 6 | 3 |
Table: RentCafe • Source: RentCafe analysis of data from Yardi Matrix, Cost of Living Index, U.S. Census Bureau, Census Business Dynamics, County Health Rankings, as of September 2025 • Get the data
Close behind are Portland, ME (#2); Des Moines, IA (#3); Albany, NY (#4); and Kansas City, MO (#5) — all known for their well-educated populations and numerous membership associations. If you’re after a neighborhood where you can work out your social muscle, these metro areas should be at the top of your list.
FAQ: Most livable metro areas
Q: What does “livability” mean in this article?
A: Livability refers to how well a metro area supports residents’ overall well-being, comfort, and social engagement in day-to-day life.
Q: What are the three main categories used to rank livability?
A: The three key categories are socioeconomics, quality of life, and location and community. These are based on criteria like cost of living, healthcare, education, and number of membership associations.
Q: What is the most livable U.S. metro area?
A: Washington, D.C., ranks as the most livable metro area thanks to its top scores in quality of life and location and community.
Q: Which U.S. region performs best for livability overall?
A: The Midwest leads with six metros in the top 20, followed by the West and Northeast with five metros each.
Q: Which metros score best for socioeconomics?
A: Springfield, MO; Charleston, SC; and Spokane, WA, rank as the top three for socioeconomics, reflecting low living costs and steady income growth overall.
Methodology
RentCafe.com is a nationwide apartment search website that enables renters to easily find apartments and houses for rent throughout the U.S.
RentCafe.com analysts compiled this ranking by looking only at contiguous metropolitan areas with a population of at least 300,000 as “suitable candidates” for the most livable metro areas. In the end, we worked with a total of 149 metropolitan areas for the ranking.
To determine the most livable metropolitan area, the RentCafe.com analytics team used a composite index to compare metros across three main categories — socioeconomics; quality of life; and location and community.
The three main categories included a total of 17 relevant metrics. Each metric received a score based on a minimum and maximum value multiplied by the metric’s weight.
To create the categories index, we repeated the ranking process and multiplied the results by each category’s overall weight.
Category 1: Socioeconomics. Category weight: 20%
- Cost of living (versus national): Weight: 20%. Source: The Cost of Living Index.
- Income growth rate: Weight: 20%. Source: Bureau of Census – American Community Survey 2024 – 1-Year Estimates.
- Poverty rate: Weight: 20%. Source: Bureau of Census – American Community Survey 2024 – 5-Year Estimates.
- Unemployment rate: Weight: 20%. Source: Bureau of Census – American Community Survey 2024 – 5-Year Estimates.
- Income inequality (Top/Bottom Earnings Ratio): Weight: 20%. Source: CountyHealthRankings.org and Bureau of Census – American Community Survey 2023 – 5-Year Estimates
Category 2: Quality of life. Category weight: 40%
- Poor physical health days: 10%. Source: CountyHealthRankings.org, Behavioral Risk Factor Surveillance System.
- Poor mental health days: Weight: 10%. Source: CountyHealthRankings.org, Behavioral Risk Factor Surveillance System.
- Food environment index: Weight: 20%. Source: CountyHealthRankings.org, USDA Food Environment Atlas and Map the Meal Gap from Feeding America.
- Access to exercise opportunities: Weight: 15%. Source: CountyHealthRankings.org, ArcGIS Business Analyst and ArcGIS Online; YMCA; US Census TIGER/Line Shapefiles.
- Physical inactivity: Weight: 10%. Source: CountyHealthRankings.org, Behavioral Risk Factor Surveillance System.
- Uninsured: Weight: 15%. Source: CountyHealthRankings.org, Small Area Health Insurance Estimates.
- Healthcare providers per 10,000 population: Weight: 20%. Source: CountyHealthRankings.org.
Category 3: Location & community. Category weight: 40%
- Highly educated residents: Weight: 20%. Source: American Community Survey 2023 – 5-Year Estimates.
- Social association rate: Weight: 10%. Source: CountyHealthRankings.org, Census County Business Patterns.
- Severe housing problems: Weight: 30%. Source: CountyHealthRankings.org, Comprehensive Housing Affordability Strategy (CHAS) data.
- Arts, entertainment and recreation establishments per 10,000 population: Weight: 20%. Source: American Community Survey 2021 – 5-Year Estimates.
- Long commute: Weight: 20%. Source: CountyHealthRankings.org, American Community Survey, 5-Year estimates.
Fair use and redistribution
We encourage you and freely grant you permission to reuse, host, or repost the research, graphics, and images presented in this article. When doing so, we ask that you credit our research by linking to RentCafe.com or this page, so that your readers can learn more about this project, the research behind it and its methodology. For more in-depth, customized data, please contact us at media@rentcafe.com.
Share this article:

Adina Dragos
Adina Dragos is a real estate writer and research analyst with RentCafe. She has solid experience in real estate writing, covering topics ranging from best cities for renters and the top cities for rental activity to cost of living. Her work was featured in several prominent media channels such as Axios, The Dallas Morning News, ConnectCRE and The New York Times.
Sign up for The Ready Renter newsletter
Get our free apartment hunting guide — plus tips, trends, and research.
")

")

Related posts

A renter’s guide to public transit in Trenton, NJ, and getting around without a car
Trenton sits at an unusual crossroads. New Jersey‘s capital is one of the few cities in the country where you can catch a train north…

5 questions to ask before renting an apartment in McAllen, TX
McAllen has a lot going for it as a place to settle down for renters. The cost of living is low, the food is outstanding,…

Apartment pool rules: The written and unwritten ones every renter should know
The community pool is one of the few amenities every resident shares at the same time. Unlike your apartment, where what you do stays behind…
Subscribe to
The Ready Renter newsletter